MFN: Compare Different Voltages (SR830 vs. SR785)
[1]:
%run test/basics.py

%matplotlib inline
import os
os.chdir('../../ana')

# IPython Interactions
import ipywidgets as wg
from IPython.display import display
Define functions
[9]:
def load_data(datapath):
    meas_data = {}
    meas_info = {}
    all_data = {}
    meas = ana.measurement.MeasurementClass()
    for f in datapath:
        f_info = meas.get_info_from_name(f)
        sr = f_info['Vin']
        nr = f_info['nr']
        meas_info[sr] = f_info
        meas_data[sr] = pd.read_csv(f, sep='\t')
        new_df = meas_data[sr]
        new_df['Vin'] = float(sr[:-2])
        if nr in all_data.keys():
            all_data[nr] = pd.concat([all_data[nr], new_df])
        else:
            all_data[nr] = new_df
    return meas_data, meas_info, all_data
Calc PSD
[11]:
def calc_PSD(meas_data):
    meas_obj = {}
    for sr, data_df in meas_data.items():
        if len(data_df['Vx']) % 1024:
            avg = len(data_df['Vx']) // 1024
            d = data_df['Vx'].iloc[:-(len(data_df['Vx']) % 1024)]
        else:
            d = data_df.Vx

        max_len = len(d)

        data = {
                    'data': d,
                    'info': {
                        'Nr': meas_info[sr]['nr'],
                        'rate': 1 / data_df.time.diff().mean(),
                        'length': max_len * data_df.time.diff().mean(),
                    }
                }

        meas_obj[sr] = ana.RAW(data,
                             rate=data['info']['rate'],
                             nof_first_spectra=32,
                             calc_first = True,
                             downsample=False,
                             )
    return meas_obj
[12]:
#%matplotlib inline
import scipy.stats

def merge_data(meas_obj, cutoff_frequency=.9):
    diff_voltages = pd.DataFrame()
    for sr, m in meas_obj.items():
        s = m.avg_spec
        s = s[s.freq < cutoff_frequency]
        if len(s) < 2:
            continue
        newdf = pd.DataFrame()
        newdf['freq'] = s.freq
        newdf['S'] = s.S
        newdf['Vin'] = float(sr[:-2])
        diff_voltages = pd.concat([diff_voltages, newdf])
    return diff_voltages


def plot_PSD_classic(diff_voltages, title, groupby_category='Vin',
                     num=10, style=[['science'], {'context': 'talk', 'style': 'white', 'palette': 'bright',}]):
    set_style(style)
    c1 = sns.color_palette("hls", num)
    sns.set_palette(c1)
    fig, ax = plt.subplots(figsize=(12,8))
    #g = sns.relplot(x='freq', y='S', hue='Vin', data=diff_voltages, height=5, kind='line')
    grouped  = diff_voltages.groupby(groupby_category)
    for group in grouped.groups.keys():
        grouped.get_group(group).plot(x='freq', y='S', kind='line',
                                      loglog=True, ax=ax,
                                      label=group,
                                      xlabel='Frequency [Hz]',
                                      ylabel='$S_{V_H}$ [$\\mathrm{V}^2/\\mathrm{Hz}$]',
                                     )
    ax.set_title(title)
    #save_plot('m506', 'png')

def show_PSD_classic(diff_voltages, title, ax=None, groupby_category='Vin',
                     num=10, style=[['science'], {'context': 'talk', 'style': 'white', 'palette': 'bright',}]):
    if not ax:
        fig, ax = plt.subplots(figsize=(12,8))
    set_style(style)
    c1 = sns.color_palette("hls", num)
    sns.set_palette(c1)
    #g = sns.relplot(x='freq', y='S', hue='Vin', data=diff_voltages, height=5, kind='line')
    grouped  = diff_voltages.groupby(groupby_category)
    for group in grouped.groups.keys():
        grouped.get_group(group).plot(x='freq', y='S', kind='line',
                                      loglog=True, ax=ax,
                                      label=group,
                                      xlabel='Frequency [Hz]',
                                      ylabel='$S_{V_H}$ [$\\mathrm{V}^2/\\mathrm{Hz}$]',
                                     )
    ax.set_title(title)
    return ax
[13]:
from matplotlib import cm
from matplotlib.colors import LogNorm

def plot_PSD_contour(meas_obj, diff_voltages, title,
                     cutoff_frequency=.9,
                     groupby_category='Vin'):
    diff_voltages_contour = pd.DataFrame()
    for sr, m in meas_obj.items():
        s = m.avg_spec
        s = s[s.freq < cutoff_frequency]
        if len(s) < 2:
            continue
        diff_voltages_contour[float(sr[:-2])] = s.S

    v = diff_voltages[groupby_category].unique()
    v.sort()
    frequencies = diff_voltages.freq.unique()
    smin, smax = diff_voltages.S.min(), diff_voltages.S.max()
    levels = np.logspace(np.log10(smin),
                         np.log10(smax), 10)

    fig, ax = plt.subplots(figsize=(12,8))
    cs = ax.contourf(v, frequencies, diff_voltages_contour,
                     norm=LogNorm(vmin=smin, vmax=smax),
                     levels=levels,
                     cmap=plt.cm.Blues,
                     )
    cbar = plt.gcf().colorbar(cs, ax=ax)
    cbar.set_label('$S_V^{V_{in}} (f)$')
    cbar.set_ticklabels(['%.1e' % _ for _ in levels])
    ax.set_yscale('log')
    ax.set_ylabel('$f$ [Hz]')
    ax.set_xlabel('$V_{in}$ [$m$V]')
    ax.set_title(title)
Load Data
[14]:
datapath = glob('./data/MFN/m506/*')
meas_data, meas_info, all_data = load_data(datapath)
meas_obj = calc_PSD(meas_data)
meas_obj.items()
[14]:
dict_items([('3000.0mV', RAW (Nr. 506)
), ('3500.0mV', RAW (Nr. 506)
), ('5000.0mV', RAW (Nr. 506)
), ('4000.0mV', RAW (Nr. 506)
), ('4500.0mV', RAW (Nr. 506)
), ('1000.0mV', RAW (Nr. 506)
), ('2500.0mV', RAW (Nr. 506)
), ('1500.0mV', RAW (Nr. 506)
), ('2000.0mV', RAW (Nr. 506)
), ('500.0mV', RAW (Nr. 506)
)])
Plot PSD
Classic
[15]:
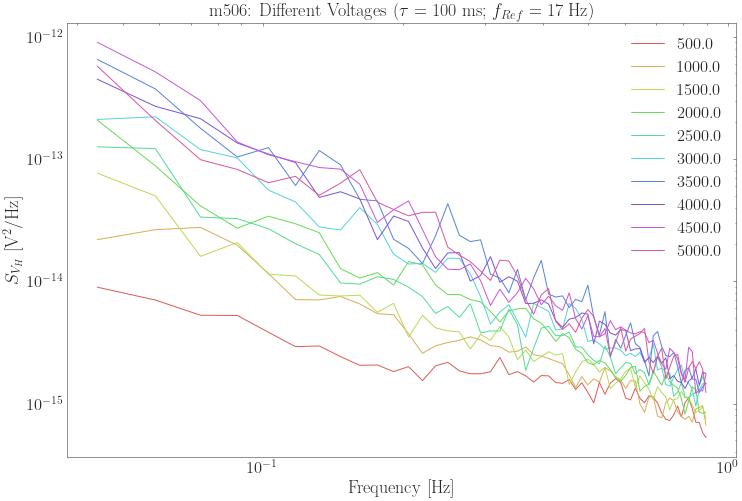
diff_voltages = merge_data(meas_obj)
plot_PSD_classic(diff_voltages, 'm506: Different Voltages ($\\tau = 100~\\mathrm{ms}$; $f_{Ref} = 17~\\mathrm{Hz}$)')
Contour
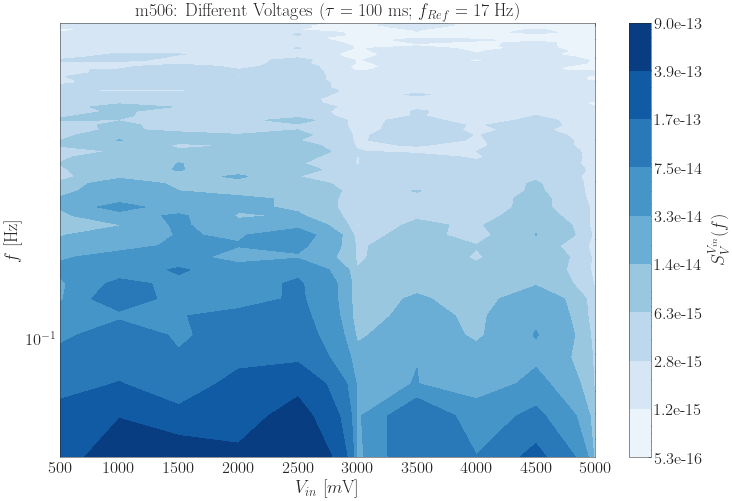
[16]:
plot_PSD_contour(meas_obj, diff_voltages, 'm506: Different Voltages ($\\tau = 100~\\mathrm{ms}$; $f_{Ref} = 17~\\mathrm{Hz}$)')
Load m499
[17]:
datapath = glob('./data/MFN/m499/*')
meas_data, meas_info, all_data = load_data(datapath)
meas_obj = calc_PSD(meas_data)
meas_obj.items()
[17]:
dict_items([('2000.0mV', RAW (Nr. 499)
), ('1500.0mV', RAW (Nr. 499)
), ('500.0mV', RAW (Nr. 499)
), ('2500.0mV', RAW (Nr. 499)
), ('1000.0mV', RAW (Nr. 499)
), ('4500.0mV', RAW (Nr. 499)
), ('4000.0mV', RAW (Nr. 499)
), ('5000.0mV', RAW (Nr. 499)
), ('3500.0mV', RAW (Nr. 499)
), ('3000.0mV', RAW (Nr. 499)
)])
[18]:
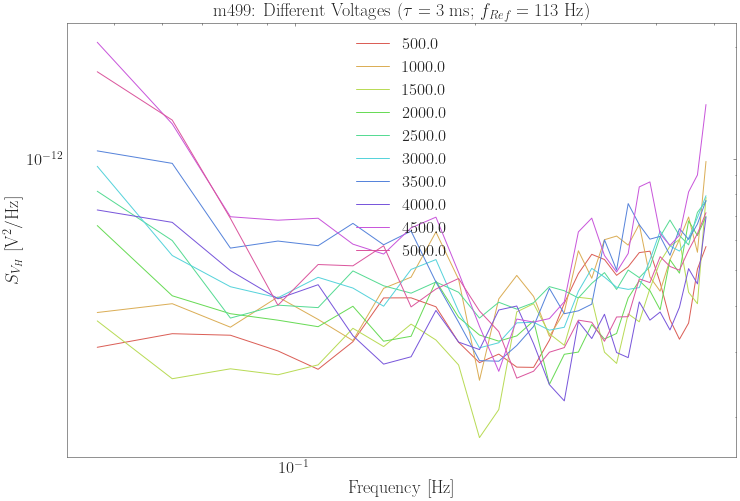
diff_voltages = merge_data(meas_obj, cutoff_frequency=.5)
plot_PSD_classic(diff_voltages, 'm499: Different Voltages ($\\tau = 3~\\mathrm{ms}$; $f_{Ref} = 113~\\mathrm{Hz}$)')
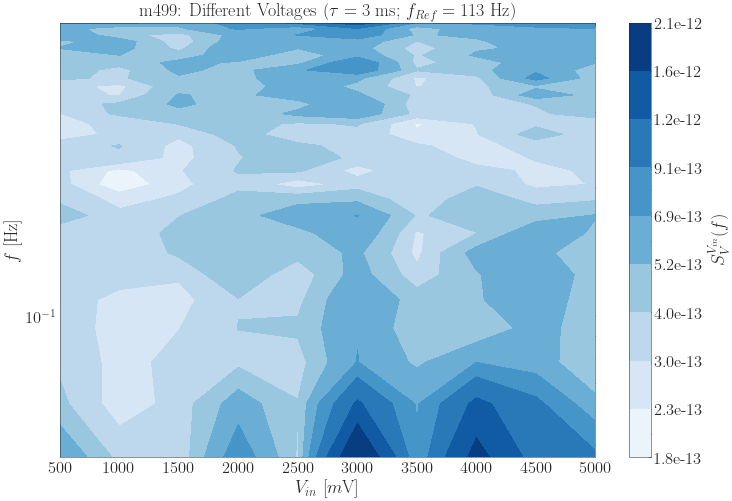
[19]:
plot_PSD_contour(meas_obj, diff_voltages, 'm499: Different Voltages ($\\tau = 3~\\mathrm{ms}$; $f_{Ref} = 113~\\mathrm{Hz}$)',
                cutoff_frequency=.5)
m498
[20]:
datapath = glob('./data/MFN/m498/*')
meas_data, meas_info, all_data = load_data(datapath)
meas_obj = calc_PSD(meas_data)
diff_voltages = merge_data(meas_obj, cutoff_frequency=.5)
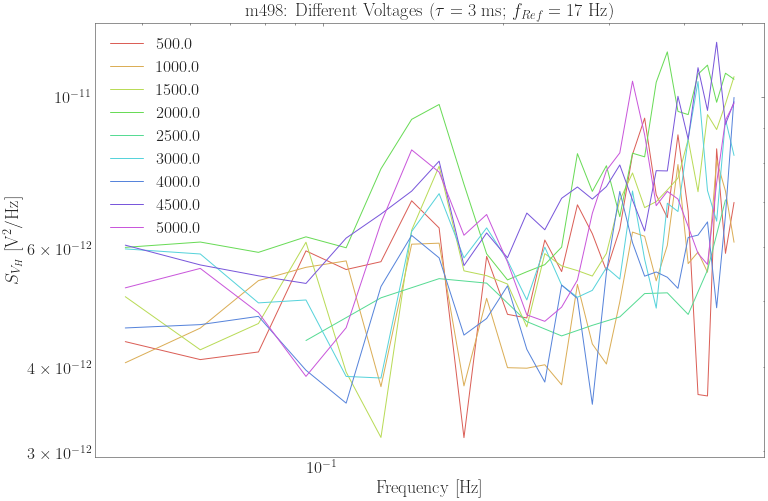
title = 'm498: Different Voltages ($\\tau = 3~\\mathrm{ms}$; $f_{Ref} = 17~\\mathrm{Hz}$)'
plot_PSD_classic(diff_voltages, title)
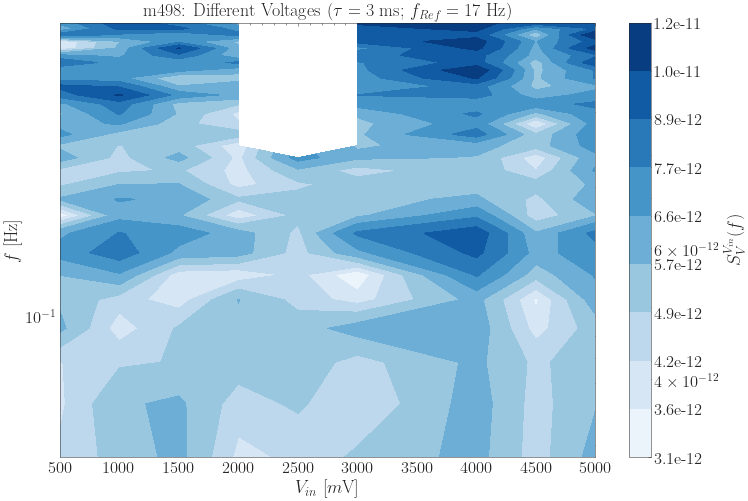
[21]:
plot_PSD_contour(meas_obj, diff_voltages, title, cutoff_frequency=.5)
[23]:
eva = ana.HandleM(directory='data/SR785')
WARNING:Handle:Start loading folder: data/SR785/m382_MFN Plusses_T5K_sweep_100 mT to -100 mT_at -1T saturation_Rate 5mTmin_SR785_1.5Hz__aver10_Vin 5V_sens 5mV .dat
WARNING:Handle:Regex doesn't match: data/SR785/MFN_go to zero2.dat
WARNING:Handle:Regex doesn't match: data/SR785/Routine MFN No3.dat
/Users/jp/Projects/Code/method-paper/ana/ana/handle.py:103: DtypeWarning: Columns (0,1,2,3,4,5,6,7,8,9,10,11) have mixed types.Specify dtype option on import or set low_memory=False.
  self.load_folder(file_list, **kwargs)
WARNING:Handle:Regex doesn't match: data/SR785/Test parallel down.dat
WARNING:Handle:Regex doesn't match: data/SR785/Routine MFN.dat
WARNING:Handle:Regex doesn't match: data/SR785/Routine MFN No2.dat
WARNING:Handle:Regex doesn't match: data/SR785/MFN_go to zero.dat
WARNING:Handle:Regex doesn't match: data/SR785/Test2 parallel down.dat
WARNING:Handle:Regex doesn't match: data/SR785/test_n1.dat
WARNING:Handle:Regex doesn't match: data/SR785/test_SR785_length5.dat
WARNING:Handle:Regex doesn't match: data/SR785/test_SR785_length.dat
WARNING:Handle:Regex doesn't match: data/SR785/test_SR785_length4.dat
WARNING:Handle:Regex doesn't match: data/SR785/test_SR785_length6.dat
WARNING:Handle:Regex doesn't match: data/SR785/test.dat
WARNING:Handle:Regex doesn't match: data/SR785/test_SR785_length3.dat
WARNING:Handle:Regex doesn't match: data/SR785/test_SR785_length2.dat
WARNING:Handle:Regex doesn't match: data/SR785/Routine Parallel measurements.dat
WARNING:Handle:Regex doesn't match: data/SR785/f.dat
[25]:
m = ana.Hloop(57)
Compare with SR785
SR785
[27]:
eva.style.set_style(default=True, grid=True,
size='talk', style='ticks', latex=True,
palette='deep')
lofm = {}
to_show = {}
for i in range(1,6):
to_show[i+377] = i
for nr, content in to_show.items():
lofm[nr] = ["$%s\\;\\mathrm{V}$" % (
content
),{}]
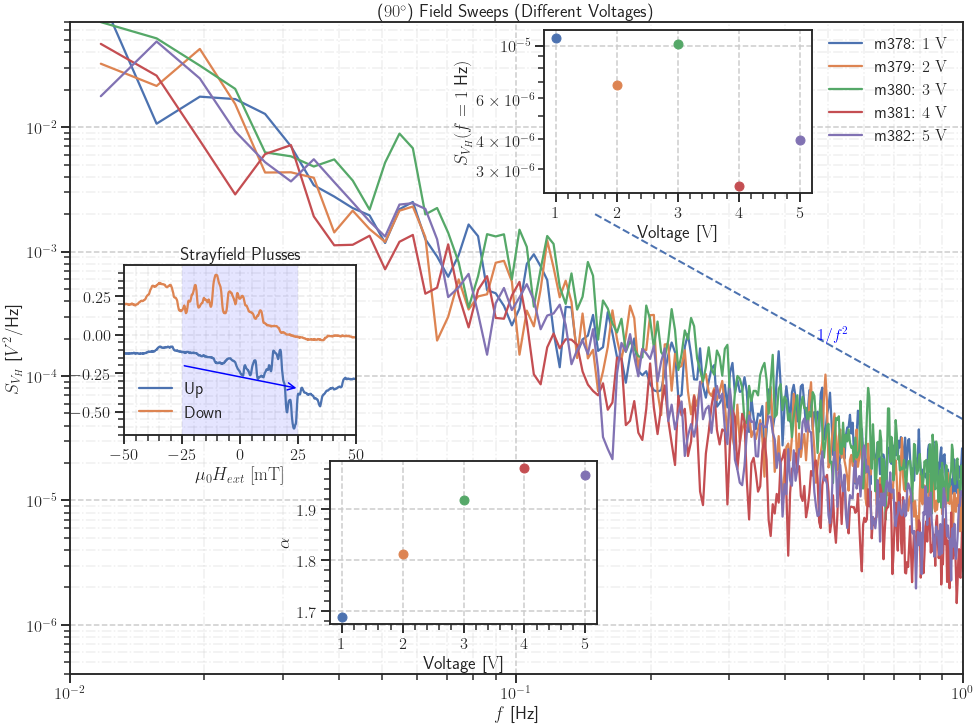
fig, ax = eva.plot(lofm,
#fit_range=(2e-2, 7e-1),
#show_fit=True,
plot_settings=dict(
title='($90^\\circ$) Field Sweeps (Different Voltages)',
xlim=(1e-2, 1e0),
ylim=(4e-7, 7e-2)),
f_settings=dict(disable=True,
xmin=5e-2,
ymin=1e-5),
f2_settings=dict(
xmin=1.5e-1,
ymin=2e-3,
),
)
# Inset with Strayfield
with sns.color_palette('deep'):
inset = inset_axes(ax, width='100%', height='100%',
bbox_to_anchor=(.07, .38, .26, .26),
bbox_transform=ax.transAxes)
m.plot_strayfield(inset, 'Strayfield Plusses',
nolegend=True,)
inset.legend(['Up',# ($-M_S \\rightarrow +M_S$)',
'Down'])# ($+M_S \\rightarrow -M_S$)'])
inset.grid(b=True, alpha=.4)
inset.set_xlim(-50, 50)
inset.set_ylim(-.65, .45)
inset.set_xticks([-50+25*_ for _ in range(5)])
#inset.set_xticks([-45+10*_ for _ in range(10)], minor=True)
inset.grid(b=True, which='minor', color='#cccccc',
linestyle='-.', alpha=.3)
#inset.set_xlabel('')
inset.set_ylabel('')
y1, y2 = -1, 2
inset.fill([-25, -25, 25, 25], [y1, y2, y2, y1], 'blue', alpha=.1)
inset.annotate("", xy=(25, -.35), xytext=(-25, -.2),
arrowprops=dict(arrowstyle="->", color='blue'))
# Inset showing fitted data
with sns.color_palette("deep"):
inset2 = inset_axes(ax, width='100%', height='100%',
bbox_to_anchor=(.54, .75, .3, .25),
bbox_transform=ax.transAxes)
inset3 = inset_axes(ax, width='100%', height='100%',
bbox_to_anchor=(.3, .09, .3, .25),
bbox_transform=ax.transAxes)
for nr, content in to_show.items():
intercept, slope = eva[nr].fit(fit_range=(2e-2, 7e-1))
voltage = content
inset2.plot(voltage, 10**intercept, 'o')
inset3.plot(voltage, -slope, 'o')
inset2.set_xlabel('Voltage [$\mathrm{V}$]')
inset2.set_ylabel('$S_{V_H} (f=1\\;$Hz$)$')
inset2.set_yscale('log')
inset3.set_xlabel('Voltage [$\mathrm{V}$]')
inset3.set_ylabel('$\\alpha$')
SR830DAQ
m506
[28]:
datapath = glob('./data/MFN/m506/*')
meas_data, meas_info, all_data = load_data(datapath)
meas_obj = calc_PSD(meas_data)
diff_voltages = merge_data(meas_obj)
fig, ax = plt.subplots(figsize=(16,12))
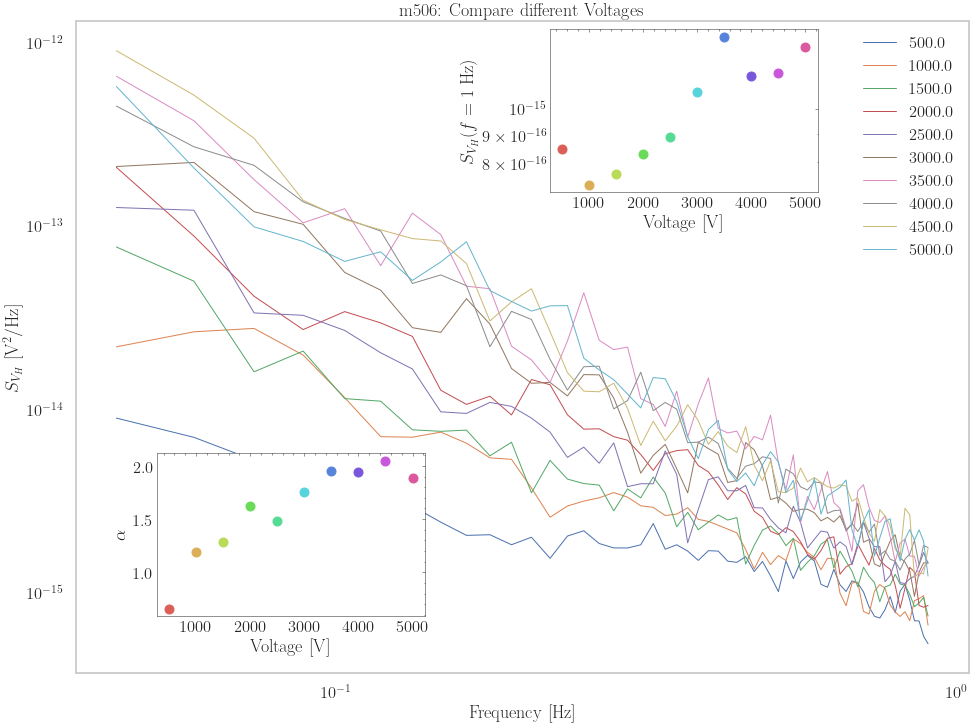
show_PSD_classic(diff_voltages, 'm506: Compare different Voltages', ax=ax)
inset2 = inset_axes(ax, width='100%', height='100%',
bbox_to_anchor=(.54, .75, .3, .25),
bbox_transform=ax.transAxes)
inset3 = inset_axes(ax, width='100%', height='100%',
bbox_to_anchor=(.1, .1, .3, .25),
bbox_transform=ax.transAxes)
grouped = diff_voltages.groupby('Vin')
for group in grouped.groups.keys():
g = grouped.get_group(group)
fit_area = g.query('freq > %f and freq < %f' % (2e-2, 7e-1))
fit_area['lnf'] = np.log10(fit_area.freq)
fit_area['lnS'] = np.log10(fit_area.S)
fit = scipy.stats.linregress(fit_area.lnf, fit_area.lnS)
intercept, slope = fit.intercept, -fit.slope
voltage = group
inset2.plot(voltage, 10**intercept, 'o')
inset3.plot(voltage, slope, 'o')
inset2.set_xlabel('Voltage [$\mathrm{V}$]')
inset2.set_ylabel('$S_{V_H} (f=1\\;$Hz$)$')
inset2.set_yscale('log')
inset3.set_xlabel('Voltage [$\mathrm{V}$]')
inset3.set_ylabel('$\\alpha$')
/var/folders/nm/0s3x_nnn1ss1n7rd1px5gqsr0000gn/T/ipykernel_34078/1220830970.py:19: SettingWithCopyWarning:
A value is trying to be set on a copy of a slice from a DataFrame.
Try using .loc[row_indexer,col_indexer] = value instead

See the caveats in the documentation: https://pandas.pydata.org/pandas-docs/stable/user_guide/indexing.html#returning-a-view-versus-a-copy
  fit_area['lnf'] = np.log10(fit_area.freq)
/var/folders/nm/0s3x_nnn1ss1n7rd1px5gqsr0000gn/T/ipykernel_34078/1220830970.py:20: SettingWithCopyWarning:
A value is trying to be set on a copy of a slice from a DataFrame.
Try using .loc[row_indexer,col_indexer] = value instead

See the caveats in the documentation: https://pandas.pydata.org/pandas-docs/stable/user_guide/indexing.html#returning-a-view-versus-a-copy
  fit_area['lnS'] = np.log10(fit_area.S)
[28]:
Text(0, 0.5, '$\\alpha$')
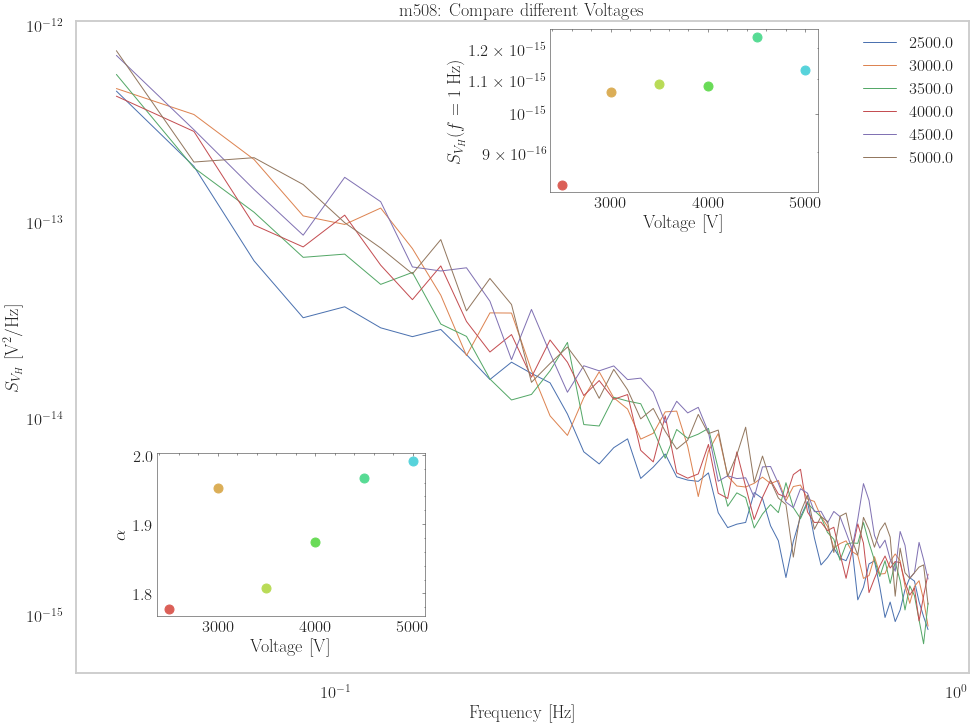
m508
[29]:
datapath = glob('./data/MFN/m508/*')
meas_data, meas_info, all_data = load_data(datapath)
meas_obj = calc_PSD(meas_data)
diff_voltages = merge_data(meas_obj)
fig, ax = plt.subplots(figsize=(16,12))
show_PSD_classic(diff_voltages, 'm508: Compare different Voltages', ax=ax)

inset2 = inset_axes(ax, width='100%', height='100%',
                   bbox_to_anchor=(.54, .75, .3, .25),
                   bbox_transform=ax.transAxes)
inset3 = inset_axes(ax, width='100%', height='100%',
                   bbox_to_anchor=(.1, .1, .3, .25),
                   bbox_transform=ax.transAxes)

grouped = diff_voltages.groupby('Vin')
for group in grouped.groups.keys():
    g = grouped.get_group(group)
    fit_area = g.query('freq > %f and freq < %f' % (2e-2, 7e-1))
    fit_area['lnf'] = np.log10(fit_area.freq)
    fit_area['lnS'] = np.log10(fit_area.S)
    fit = scipy.stats.linregress(fit_area.lnf, fit_area.lnS)
    intercept, slope = fit.intercept, -fit.slope
    voltage = group

    inset2.plot(voltage, 10**intercept, 'o')
    inset3.plot(voltage, slope, 'o')

inset2.set_xlabel('Voltage [$\mathrm{V}$]')
inset2.set_ylabel('$S_{V_H} (f=1\\;$Hz$)$')
inset2.set_yscale('log')

inset3.set_xlabel('Voltage [$\mathrm{V}$]')
inset3.set_ylabel('$\\alpha$')
/var/folders/nm/0s3x_nnn1ss1n7rd1px5gqsr0000gn/T/ipykernel_34078/2035017012.py:19: SettingWithCopyWarning:
A value is trying to be set on a copy of a slice from a DataFrame.
Try using .loc[row_indexer,col_indexer] = value instead

See the caveats in the documentation: https://pandas.pydata.org/pandas-docs/stable/user_guide/indexing.html#returning-a-view-versus-a-copy
  fit_area['lnf'] = np.log10(fit_area.freq)
/var/folders/nm/0s3x_nnn1ss1n7rd1px5gqsr0000gn/T/ipykernel_34078/2035017012.py:20: SettingWithCopyWarning:
A value is trying to be set on a copy of a slice from a DataFrame.
Try using .loc[row_indexer,col_indexer] = value instead

See the caveats in the documentation: https://pandas.pydata.org/pandas-docs/stable/user_guide/indexing.html#returning-a-view-versus-a-copy
  fit_area['lnS'] = np.log10(fit_area.S)
[29]:
Text(0, 0.5, '$\\alpha$')
[ ]: